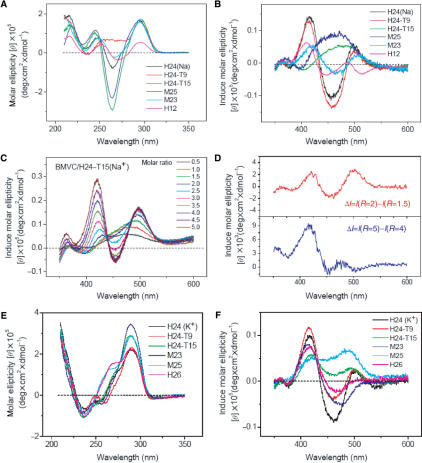
Figure 3.
(A) CD spectra of H24, H24-T9, H24-T15, M25, M23 and H12 and (B) the corresponding induced CD spectra of 20 μM BMVC upon interaction with these G4 structures at their molar ratio 1:1 in Na+ solution. (C) Induced CD spectra of BMVC upon interaction with H24-T15 at molar ratio from 0.5 to 5.0 in Na+ solution. (D) Differential spectra obtained from the difference between the induced CD spectra at molar ratios of 2 and 1.5 (upper) and molar ratios of 5 and 4 (lower). (E) CD spectra of H24, H24-T9, H24-T15, M25, M23 and H26 and (F) the corresponding induced CD spectra of 20 μM BMVC upon interaction with these G4 structures at their molar ratio 1:1 in K+ solution.

