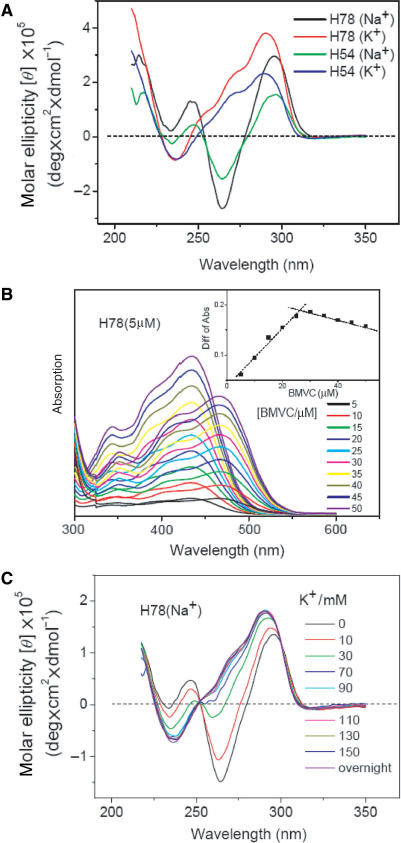
Figure 7.
(A) CD spectra of 10 μM H54 and 10 μM H78 DNA in the solutions containing 150 mM of Na+ or K+ cation. (B) Absorption spectra of free BMVC and its complexes with H78 in Na+ solution upon BMVC titration. The inset shows the job plots to determine the binding ratio. (C) CD spectra of 5 μM H78 in 150 mM Na+ solution upon K+ titration.

