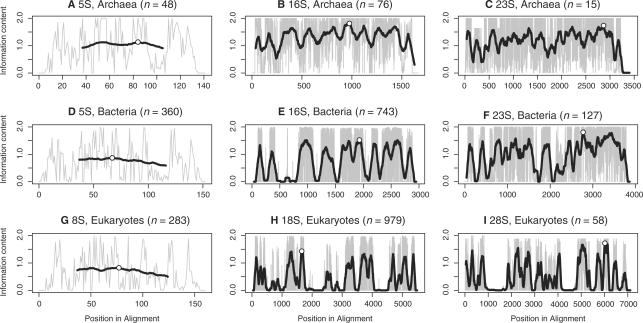
Figure 1.
The graphs show conservation in the alignments as measured by information content: C=∑ifilog2(fi/qi) where i sums over the four nucleotides, fi is the frequency of nucleotide i in the column and qi =1/4 is used as the background frequency. Ambiguous nucleotide symbols were evenly divided between the corresponding fi, gaps between all four nucleotides. The grey line represents the value for each position in the alignment, the black line is a running average over 75 nt around the current position, whereas the white dot indicates the center of the most conserved 75 nt region of the alignment.

