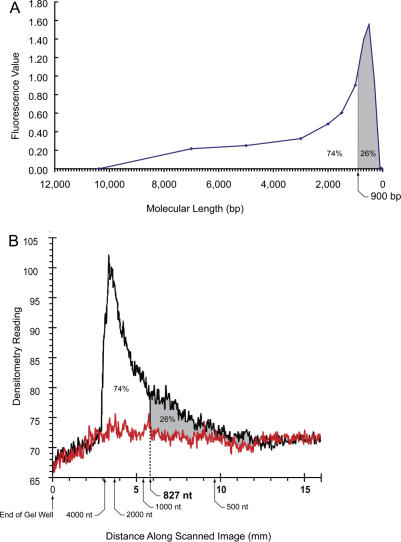
Figure 4.
Microfluidics separations of the bisulfite-treated DNA. (A) Bisulfite-treated DNA was separated by capillary electrophoresis on microfluidics chips as previously described (26). Representative results depicted in virtual scan format were replotted to display the profile on a linear molecular length scale. (B) Bisulfite-treated DNA was separated by PAGE using 8 M urea to prevent secondary structure formation. Both methods give approximately the same value for the number average molecular weight of single-stranded DNA fragments. Note the differences in abscissas on the two graphs result from the differences between the two methods. The microfluidics system yields molecular lengths calculated from retention times for duplex DNA markers in base pairs. The standard denaturing electrophoresis system is measured in distance from the origin calibrated against RNA markers in nucleotides. The direction of electrophoresis is from left to right in both graphs.

