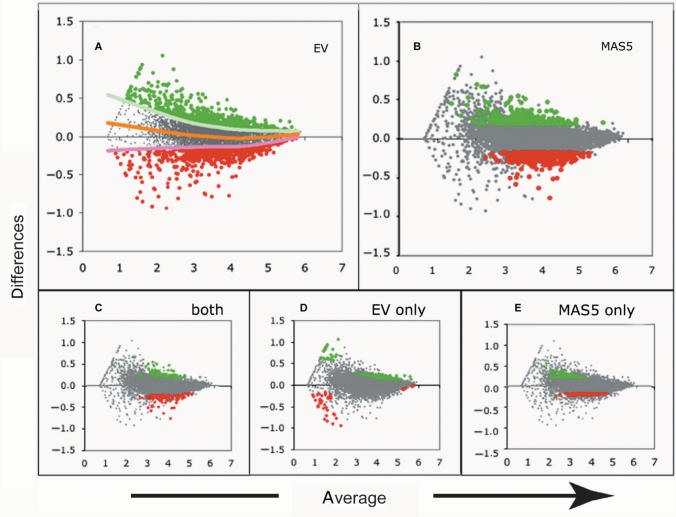
Figure 5.
Differentially expressed genes selected using spline or MAS5 Affymetrix selection. MA plots of scaled log-transformed signals for probe sets from two experimental conditions of the B6.1 cells, using the same dataset and color codes as in Figure 4. (A) Distribution of 555 genes (P-value = 0.05) selected upon a spline fit. (B) Distribution of 555 genes selected by MAS5 (FC = 1.8). (C) Distribution of genes selected by both approaches. (D) Distribution of genes selected by EV (spline fit) alone. (E) Genes selected by FC on MAS5 alone.

