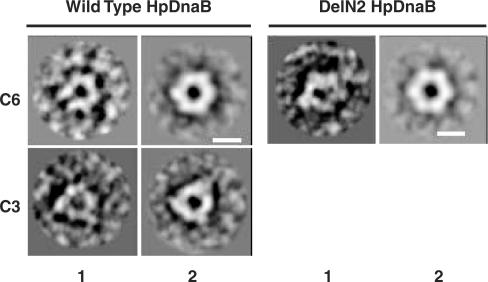
Figure 4.
Electron microscopic observation and analysis of HpDnaBWt, DelN2, DelN3 and DelC1. Above four proteins were processed for electron microscopy as described in the materials and methods and individual sample was scanned under a Morgagni 268 transmission electron microscope at 80 kV voltage. More than hundred images were captured in each case and the raw images were processed using IMAGIC software. The left panel in each pair shows the unprocessed image and the right panel shows the processed image. HpDnaBWt was found in both C6 and C3 conformations whereas DelN2 was found only in C3 conformations. Bars in the panels are equivalent to 10 nm.

