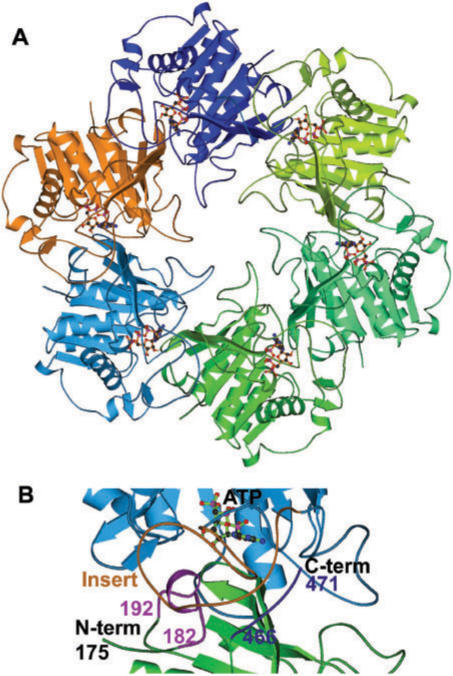
Figure 7.
Homology modeling of HpDnaB. (A) Homology model of HpDnaB based on the T7 helicase domain as template. Six subunits are shown in different colors. The nucleotide (ATP) coupled to each monomer is also shown. (B) Close-up view of interface between two monomers. Two monomers are shown in different colors (cyan and green) and nucleotide (ATP) is shown in ball & stick model. The 34 residues insert from one molecule (brown) is interacting with N-terminal (182–192, light pink) and C-terminal (466–471, dark blue) regions of the next molecule are also shown.

