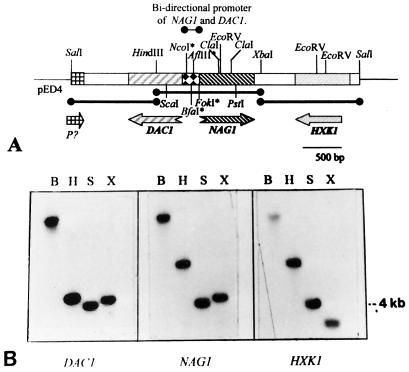
Figure 1.
Genomic organization of GlcNAc catabolic genes and NAG gene cluster in C. albicans. (A) Schematic representation of the clustered organization of the 4-kb SalI genomic clone fragment in pED4. The hatched boxes represent the three ORFs. Restriction nuclease sites marked with asterisks (*) are nonunique. The shaded arrows at the bottom represent the direction and position of the various reading frames: DAC1, NAG1, and HXK1 (arrow depicts a partial sequence). The bar indicates the scale of the map. The dotted box denotes the bidirectional promoter of NAG1 and DAC1. The bold lines represent the fragments used for probes for Northern and Southern analyses. P indicates the partial sequence of putative permease gene. (B) Southern blots of C. albicans SC5314 genomic DNA digested with BamHI (B), HindIII (H), SalI (S), and XbaI (X) were hybridized with the probes as indicated in the three panels. The common 4-kb SalI band detected in all three blots represents the gene cluster.

