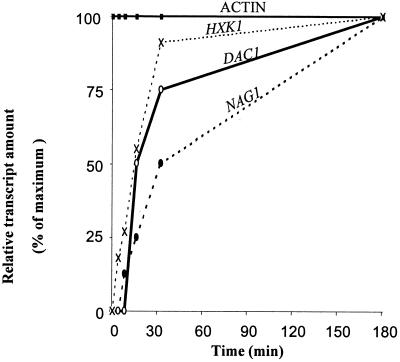
Figure 2.
Induction kinetics of the GlcNAc-induced RNA. RNA was isolated from 4, 8, 16, 32, and 180 min of GlcNAc-induced cells. Four copies of blots were prepared, and the various transcript levels were analyzed by hybridization to individual gene-specific probes. A graph representing the optical quantitation of density from the autoradiogram is presented. The maximum level of each transcript has been taken as 100%, and the various time points are represented as fractions thereof. The 0 time refers to no GlcNAc addition. The signal for actin was taken as control. The transcripts are depicted as NAG1 (●), DAC1, (○), HXK1 (×), and actin (■).

