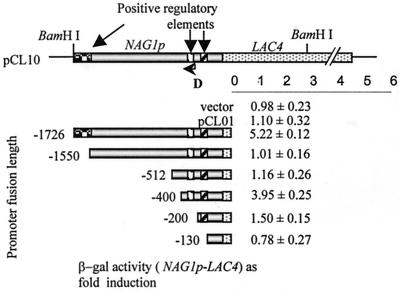
Figure 3.
Analysis of NAG1 promoter deletion constructs. A schematic representation of the NAG1 promoter-reporter construct indicating relative positions of three putative positive regulatory elements depicted by one stippled and two hatched boxes. Constructs shown at lower left contain 1,726, 1,550, 400, 200, and 130 bp of NAG1 5′ flanking region from translation start ATG. The β-galactosidase activities are represented as fold induction by GlcNAc (the ratio of induced to uninduced β-galactosidase activity). The data represent an average of three independent transformants each tested thrice. The putative DAC1 start site is indicated by arrow D.

