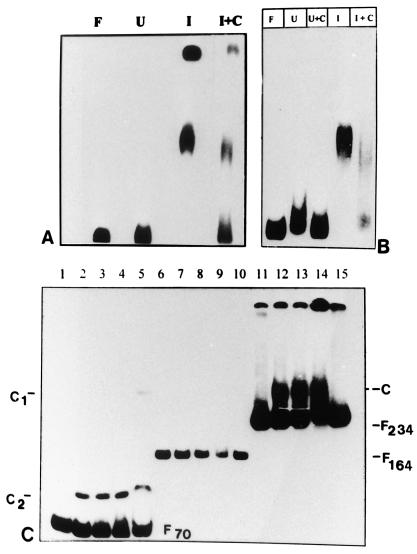
Figure 4.
DNA GMSA of different regions of NAG1 promoter. (A) The −497 to −195 region of the NAG1 promoter was analyzed in a GMSA with 20 μg of crude induced (I) and crude uninduced (U) extract. C1 and C2 indicate the two complexes formed by the probe with induced extract. I + C indicates the competition assay with 25-fold molar excess of the unlabeled probe DNA. (B) The assay of the proximal region of the NAG1 promoter (−200 to +34) was performed with crude cell extracts. Then 20 μg of crude induced (lanes I and I + C) or uninduced (lanes U and U + C) cell extracts were incubated with an end-labeled 234-bp probe either in the absence (lanes U and I) or in the presence (lanes U + C and I + C) of unlabeled specific-competitor DNA. The reaction mixture was resolved on a 6% nondenaturing PAGE. Lane F indicates free probe. (C) DNA GMSA with probes 70 bp (−200 to −131; lanes 1–5), 164 bp (−130 to +34; lanes 6–10), and 234 bp (−200 to +34; lanes 11–15). The amounts of proteins used were 20 μg (lanes 2, 7, and 12), 40 μg (lanes 3, 8, and 13), and 60 μg (lanes 4, 9, and 14). Lanes 1, 6, 11, and 15 contain free probe as indicated by F70, F164, and F234. Protein (20 μg) partially purified through DEAE-Sephacel column was used in lanes 5 and 10. Protein–DNA complexes (C, C1, and C2) shown on both sides of the gel were resolved on an 8% nondenaturing gel. Although the amount of the 164-bp probe is much less than that of either the 70-bp or 234-bp probes, a longer exposure of the gel did not reveal any new bands.

