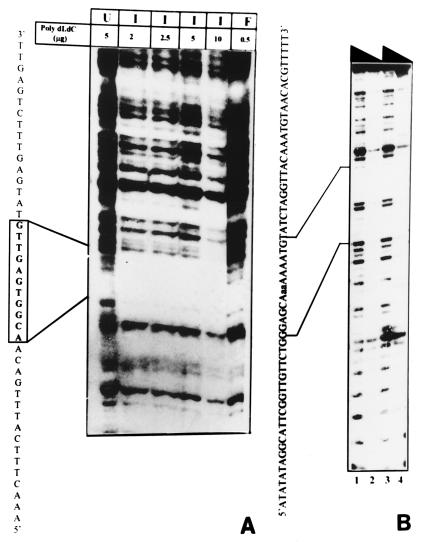
Figure 5.
DNase I footprinting assay. (A) DNase I footprinting assay of the 214-bp probe with crude uninduced (U) and induced (I) cell extracts. The footprinting region (Box B) corresponds to the nucleotide sequence as shown to the left. F indicates DNase I-digested free probe. (B) DNase I footprinting assay of the 82-bp probe performed with crude induced cell extract (140 μg). DNase I used was 0.11units (lanes 1 and 3) and 0.04 units (lanes 2 and 4). The sequence shown on the left indicates the position of the footprint (Box A).

