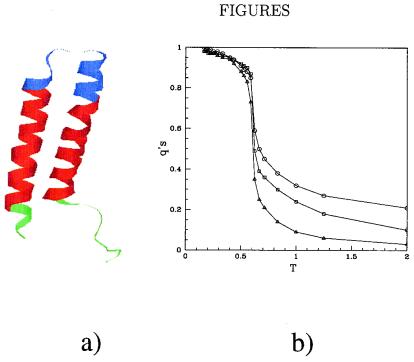
Figure 1.
Structure and thermodynamics of the helical transmembrane protein. (a) Ribbon representation of the two-helix fragment of bacteriorhodopsin formed by the first 66 aa. The part inside the membrane (determined by using the neural network learning algorithm available at http://www.embl-heidelberg.de/Services/sander/predictprotein/) is shown in red, the part above (below) the membrane in blue (green). (b) Average equilibrium fraction of native contacts outside, qb (○), inside, qm (□), and across, qs (▵), the membrane as a function of the temperature T. All these quantities are expressed in energy unit of ɛ (see Appendix). The folding transition temperature TC when all the curves cross the value 1/2 is approximately 0.6. This value is in accord with the temperature of the heat capacity maxima.

