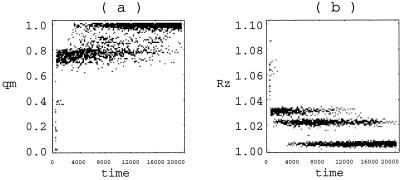
Figure 4.
Distribution of the fraction of native contacts inside the membrane (a) and of the normalized z coordinate of the center of mass (Rz = zcm/znatcm) (b). The data were obtained by using 40 independent kinetic simulations with pathway U → HI → HV → N. The grey-scale distribution indicates the probabilities at given times: darker points denote higher probability.

