
Fig. 1. Quantification of DYRK1A brain levels in control and trisomic Ts65Dn mice.
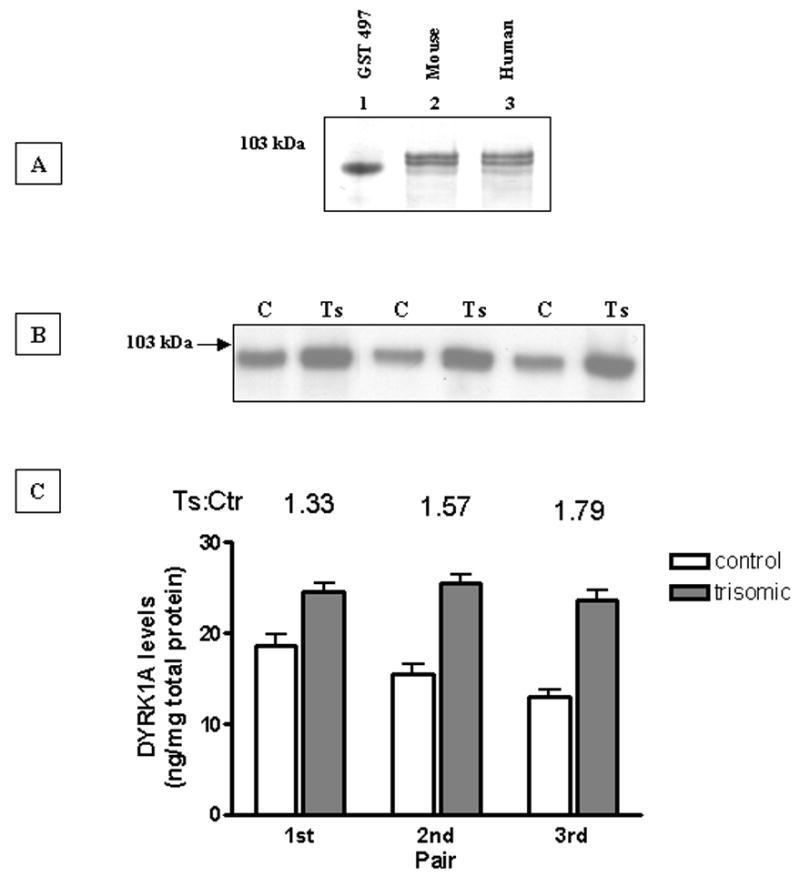
(A): Western blot analysis of DYRK1A isolated through Ni-affinity chromatography from mouse and human brain. Whole mouse brain (lane 2) and frontal cortex of 32-year old control subject (lane 3) were lysed in 6 M GuHCl, purified by IMAC, separated on 8% tricine SDS-polyacrylamide gel and immunobloted with 1:5000 dilution of 7F3 antibody. The blot was developed by color reaction using AP-conjugated secondary antibody and BCIP/NBP substrate. Lane 1 was loaded with 20 ng of GST-497 recombinant fusion DYRK1A protein standard.
(B): Representative Western-blot of three control (C)/trisomic(Ts) pairs of Ts65Dn mice. Equal loads of Ni-sepharose purified samples were resolved in 8% SDS-PAGE and immunoblotted with 1:5000 dilution of 7F3 antibody. Blots were developed by chemiluminescence using AP-conjugated secondary antibody.
(C): DYRK1A levels quantified by densitometric analysis of three independent Western blots as shown in (A). The density of immunoreactive bands was normalized with 20 ng of purified GST-497 recombinant DYRK1A protein and expressed as ng/mg of total protein of brain lysate. For all three pairs, the difference was statistically significant (P < 0.05) as established by paired Student’s t test.