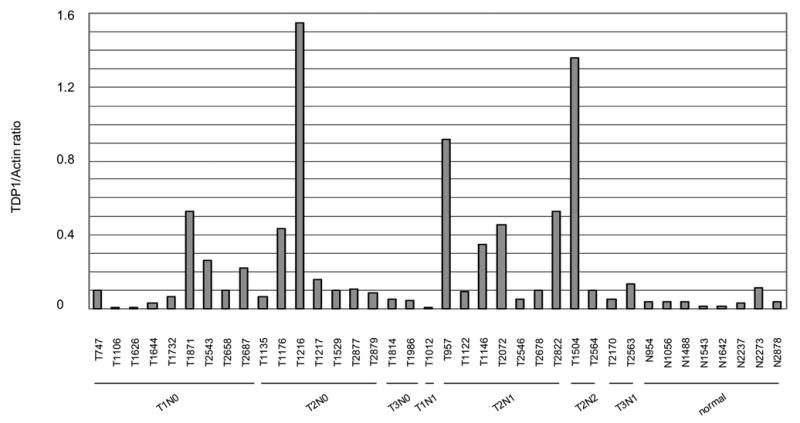
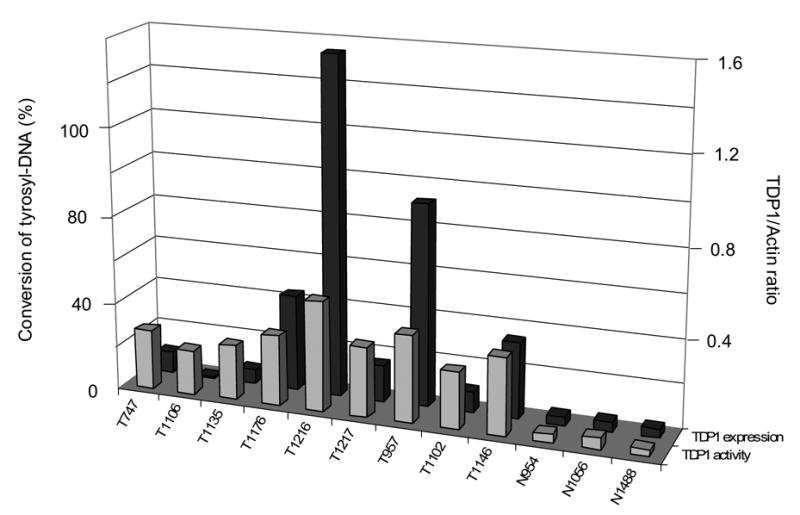
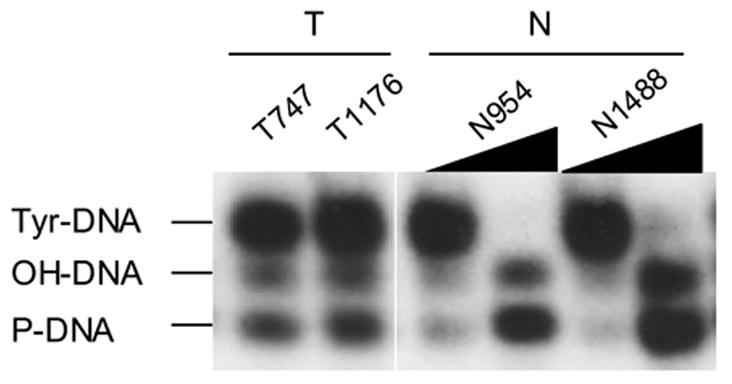
Figure 1.


Expression and activity of TDP1 was increased in un-matched NSCLC. A: Quantitative analysis of the protein expression levels of TDP1 of thirty un-matched NSCLC versus eight non-neoplastic tissues, normalized with their expression of β-actin using ImageJ. The samples were run on different gels, and the blotting variations between gels were adjusted using the ratio of TDP1/Actin of N954 that was loaded on every gel. B: Western blotting of representative samples as shown in A. All samples were loaded with 32 μg of tissue extract. C: Quantification of TDP1 enzymatic activity of nine tumor samples versus three non-neoplastic tissues and the comparison with their protein expression levels. All samples were assayed with 80 ng of tissue extract. D: Electrophoresis of the reaction products of TDP1 enzymatic assay on a sequencing gel. The samples were representatives of C. Tumor samples were assayed with 80 ng of tissue extract, and non-neoplastic tissues were assayed with 80 ng and 4 μg of extract. The upper bands were the 18 mer Tyr-DNA substrate; the lower ones converted hydroxyl- and phosphoryl-DNA, respectively. A–D: N, non-neoplastic tissue; T, tumor. The lab ID number was used to name each sample.
