
Figure 2.
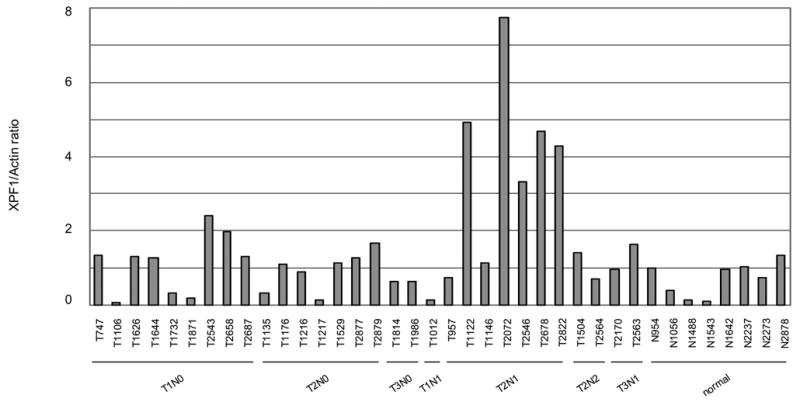
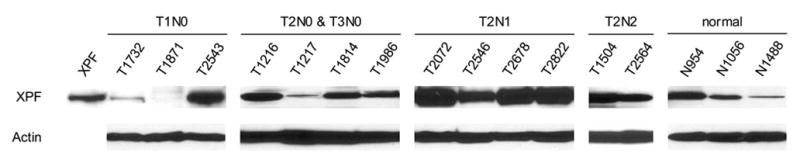
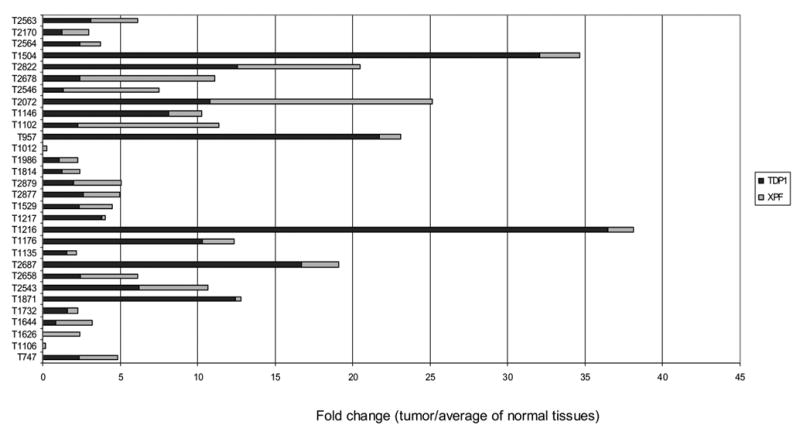
Expression of XPF was increased in un-matched NSCLC. A: Quantitative analysis of the protein expression levels of XPF of thirty un-matched NSCLC versus eight non-neoplastic tissues. Normalization was done as described in Fig. 1A. B: Western blotting of representative samples as shown in A. All samples were loaded with 32 μg of tissue extract. All samples were loaded with 32 μg of tissue extract. C: Comparison of the fold changes of overexpressed TDP1 and XPF relative to the average expression level of non-neoplastic tissues. A–C: N, non-neoplastic tissue; T, tumor.