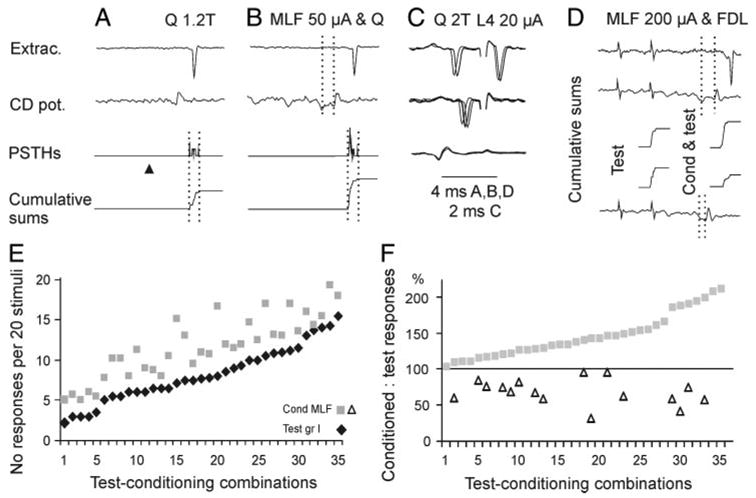
FIG. 5.

Modulation of activation of Ib interneurons. A and B, top to bottom: examples of responses of an interneuron, cord dorsum potentials, peristimulus time histograms (PSTHs), and cumulative sums of responses, evoked by quadriceps (Q) stimulation alone and after conditioning stimulation of the MLF. Number of responses evoked by 20 stimuli was increased from 10 to 17. Dotted lines in top of B indicate conditioning–testing interval and those in the bottom, the time windows within which the counts were made. C: collision test for antidromic activation of the same interneuron from the lateral funiculus at the border between the L3 and L4 segments (20 μA), extracellular records (4 superimposed single traces, top and middle traces), and records from the cord dorsum. Note that the L4 stimuli (shock artifacts truncated) stopped to activate the neuron when the interval between the synaptically evoked spikes and these stimuli was reduced (middle traces). D: records from another Ib interneuron projecting to the L3/L4 segment. Top traces: responses of the interneurons and cord dorsum potentials when test stimuli were preceded by conditioning stimuli, at a conditioning testing interval indicated by the dotted lines. Bottom trace: cord dorsum potentials at a shorter conditioning–testing interval. Middle traces: cumulative sums of responses evoked by the same test when applied alone and when preceded by conditioning MLF stimuli at the 2 intervals. Note facilitation at a longer interval and depression at the shorter one. E: mean number of facilitated responses of 31 interneurons to nerve stimuli alone (ranked in the increasing order) and when these were preceded by conditioning MLF stimulation (35 test-conditioning combinations). F: plot of both facilitated (filled squares) and depressed (open triangles) conditioned responses in percentage of the test responses. Data are ranked from the weakest to the most potent facilitation from MLF.
