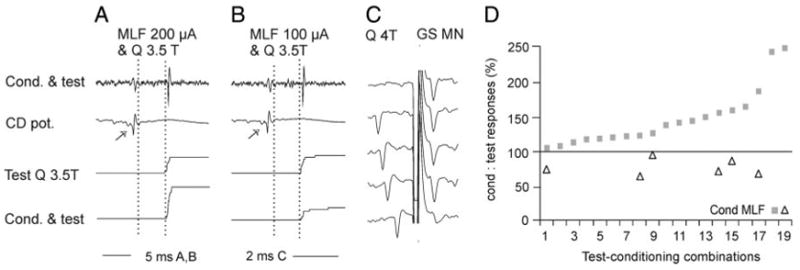
FIG. 6.

Modulation of activation of group II interneurons. A and B: data for an interneuron antidromically acticated from the gastrocnemius-soleus (GS) motor nucleus. Each panel shows (i) an example of records from the interneuron, (ii) records of afferent volleys after stimulation of the ipsilateral Q and of MLF, and (iii) cumulative sums of responses evoked by 20 consecutive test stimuli applied alone or preceded by conditioning stimuli. Conditioning stimuli in A were of 200 μA and in B of 100 μA; note that they were followed by an increase and a decrease in the number of responses, respectively. Dashed lines indicate the estimated time of arrival of afferent volleys in group II afferents and the shortest latencies of the test and conditioned responses. Arrows indicate the last descending relayed conditioning volleys. C: summary of effects from MLF on the whole sample of 16 interneurons (19 test-conditioning combinations). They are expressed in percentage increases, or decreases in the number of responses evoked by 2 or more series of 20 consecutive stimuli when these were preceded by stimulation of the MLF, compared with the number of responses evoked when the test stimuli were applied alone at optimal parameters.
