
Figure 2.
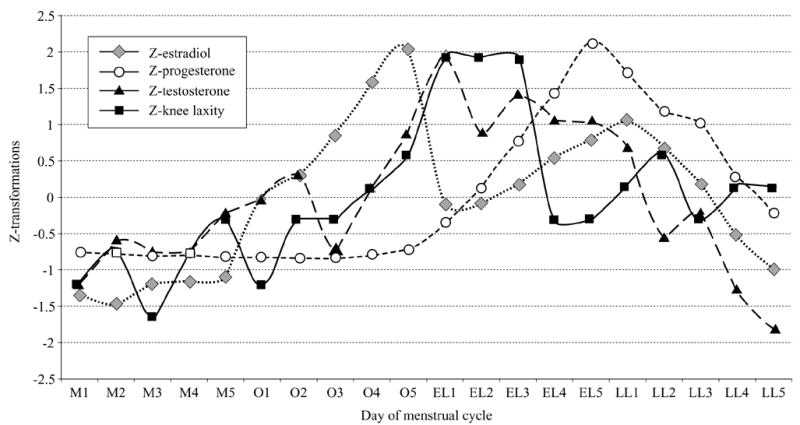
Graphic representation of changes in serum hormone levels and knee laxity values in females across the 20 days of the menstrual cycle. Each value was converted to Z-scores to allow equivalent scaling. M1 – −M5 =: days of menses; O1 – −O5 =: days of the initial estradiol rise near ovulation; EL1 – −EL5 =: days of the early luteal phase (rise in progesterone <2 ng/mL); LL1–LL5=: days of the late luteal phase (decline in progesterone levels).