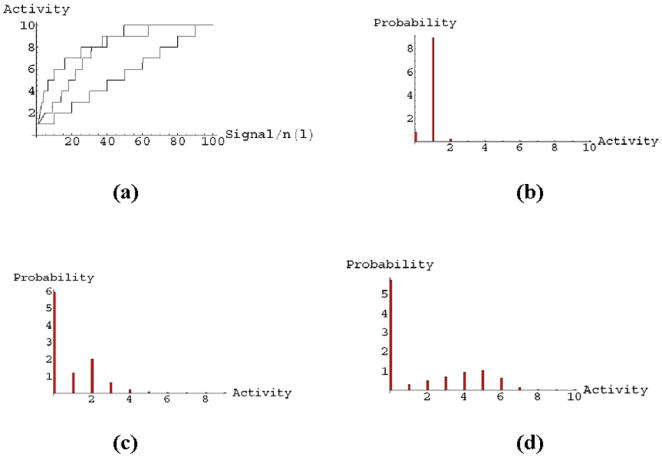
Figure 9. Discrete signal death statistics.

a) Relations between the normalized signal, sl/n(l), arriving at a gene and it's discrete activity, from the top the behaviors are for the logarithmic function, Eq. (13), the sigmoidal function, Eq. (14) and the linear function, Eq. (12). The death statistics for these three models: b) linear function; c) sigmoidal function; d) logarithmic function. It is clear that the distribution of death activities becomes bimodal and broader as we go from the linear function to the logarithmic function.
