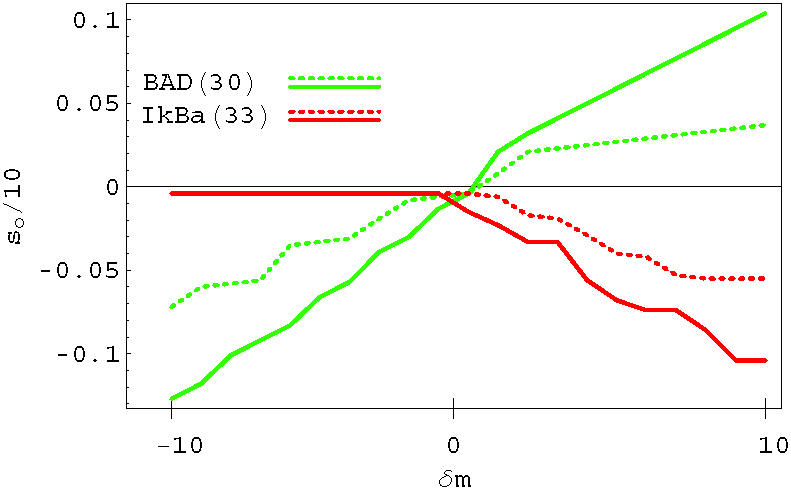
Figure 15. Output signal as a function of the perturbation strength on a pro-apoptosis (BAD, red increasing line) and anti-apoptosis node (IkBa, green decreasing line).

The dashed line and the solid line refers to two different individuals.

The dashed line and the solid line refers to two different individuals.