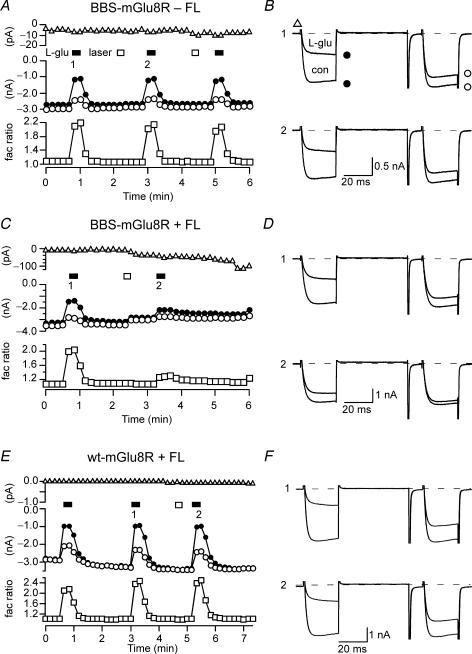
Figure 4. Laser illumination accelerated the rate of FALI.
A, C and E, time course of the holding current (upper), ICa amplitudes (centre) and facilitation ratio (lower) for BBS–mGluR8a-expressing neurons in the absence (A) or presence (C) of FL–BTX labelling and for wt-mGluR8a-expressing neurons in the presence of FL–BTX application (E). The measurement of the holding current, the prepulse and postpulse ICa and facilitation ratio were as described in Fig. 2. B, D and F, superimposed ICa traces evoked with the double-pulse voltage protocol in the absence or presence of l-Glu (100 μm) from BBS–mGluR8a-expressing neurons in the absence (B) or presence of FL–BTX labelling (D) and wt-mGluR8a-expressing neurons in the presence of FL–BTX application (F). The upper panel (1) and lower panel (2) represent the prepulse ICa inhibition before and after illumination, respectively.

