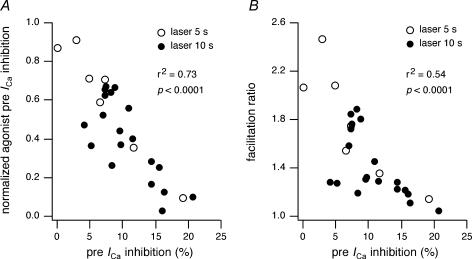
Figure 6. Correlation between agonist-mediated and direct effects of FALI.
A, the normalized agonist-induced prepulse ICa inhibition after 5 s (^) or 10 s (•) was plotted versus laser-induced basal prepulse ICa inhibition. The basal prepulse ICa inhibition was calculated as the percentage change of the current after laser illumination. B, the facilitation ratio was plotted versus laser-induced basal prepulse ICa inhibition.

