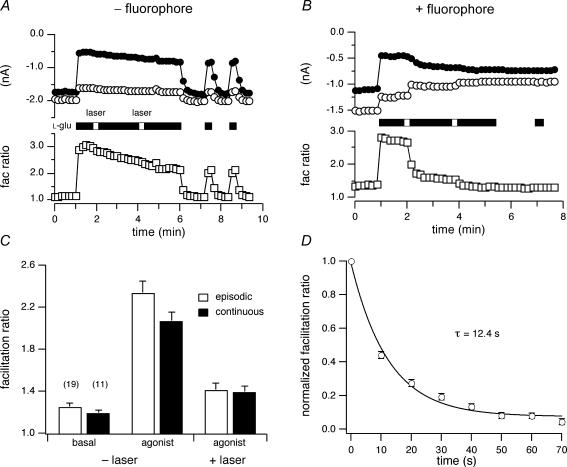
Figure 7. Time course of FALI-induced changes in ICa inhibition.
A and B, time courses of the ICa amplitudes (upper) and facilitation ratio (lower) for BBS–mGluR8a-expressing neurons in the absence (A) or presence of FL–BTX labelling (B). C, the effect of episodic (open bars) and continuous (filled bars) laser illumination on facilitation ratio. D, mean ± s.e.m. (n = 6–7) normalized facilitation ratios were plotted versus time following 10 s illumination. Facilitation ratio was normalized by subtracting the steady-state component and dividing the facilitation ratio by the first value acquired following illumination. The continuous line represents the best fit to a single exponential function obtained using non-linear regression.

