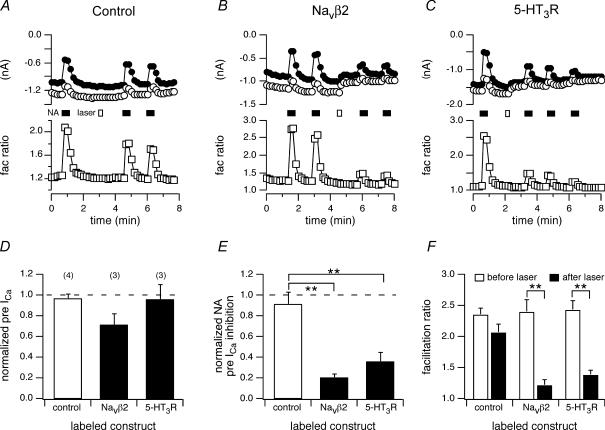
Figure 8. Laser illumination-attenuated noradrenaline-induced ICa modulation in BBS–NaVβ2- and 5-HT3R–2BBS-expressing neurons labelled with FL–BTX.
A, B and C, time courses of the ICa amplitudes for control (A), FL–BTX labelling, BBS–NaVβ2-expressing (B) and FL–BTX labelling, 5-HT3R-expressing (C) neurons. ICa amplitude was measured 10 ms after initiation of the test pulse (+10 mV). The filled bars indicate 10 s laser illumination and the open bars indicate applications of noradrenaline (NA, 10 μm). D, E and F, the effect of 10 s laser illumination on normalized basal prepulse ICa amplitude (D), NA-induced ICa inhibition (E) and facilitation ratio in the absence (open bars) or presence (filled bars) of FL–BTX labelling in neurons expressing the indicated construct. The measurement of the prepulse ICa, normalized agonist-induced inhibition and facilitation ratio were as described in Fig. 3. **P < 0.01, ***P < 0.001 compared with the control groups.

