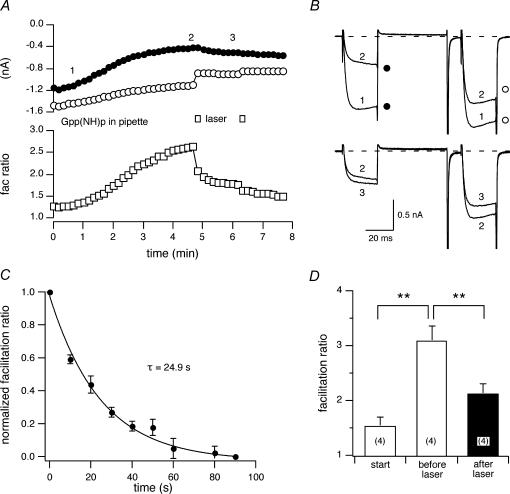
Figure 9. The effect of laser illumination on GPCR-independent ICa modulation.
A, time courses of ICa amplitudes for FL–BTX-labelled 5-HT3R–2BBS-expressing neurons. Guanylyl imidophosphate (Gpp(NH)p, 0.5 (mm) was included in the pipette solution. The open bars indicate 10 s laser illumination. B, superimposed ICa traces at the time immediately following rupture of the cell membrane (1), steady-state modulation (2) and after laser illumination (3). C, mean ± s.e.m. (n = 4) normalized facilitation ratios were plotted versus time following 10 s of illumination. The normalization of facilitation ratio was as described in Fig. 7D. The continuous line represents the best fit to a single exponential function obtained using non-linear regression. D, the effect of intracellular Gpp(NH)p and 10 s laser illumination on the facilitation ratio. **P < 0.01.

