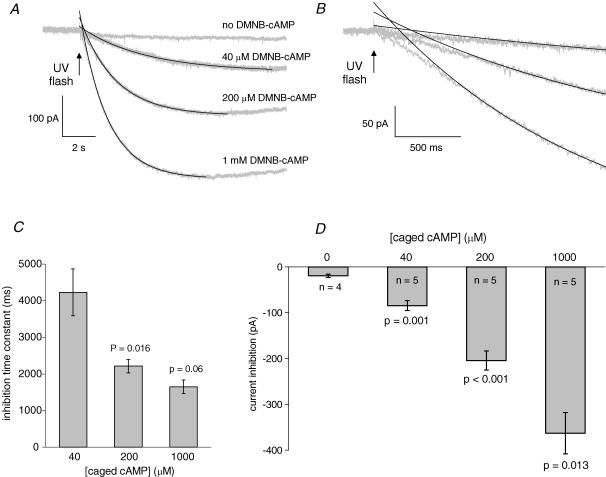
Figure 5. The kinetics of K+ current inhibition by rapid release of cAMP.
A, membrane current responses (grey) and single exponential fits (black) to a UV flash in the presence of different concentrations of caged cAMP, or no caged cAMP. B, expansions of the traces in A to show the delay in predicted inhibition observed at all caged cAMP concentrations. C, pooled data (n = 5) for the inhibition time constants at different caged cAMP concentrations as follows: 4.2 ± 0.6 s (40 μm); 2.2 ± 0.2 s (200 μm); 1.7 ± 0.2 s (1000 μm). D, peak current inhibition following the release of increasing concentrations of cAMP. In the absence of caged cAMP a small flash artefact is present.

