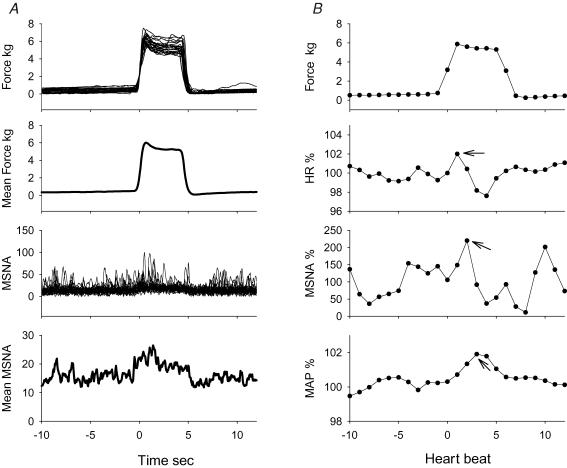
Figure 2. Example of signal averaging in one representative subject.
A, raw tracing and the averaged signals of force and neurogram during stretch in one subject. The averaging was performed directly with recorded signals. It should note that averaged neurogram tracing was not low in the later portion of the stretch, while MSNA was clearly suppressed in the period. B, averaged force and responses of heart rate (HR), MSNA, mean blood pressure (MAP) by stretch with the processed beat-by-beat data in the same subject. The responses were expressed as a percentage of the respective mean values of 10-beats data prior to the stretch. There were transient increases in heart rate, MSNA and blood pressures after onset of the stretch. The values of the peak responses (indicated with arrows) and the delay were selected from each subject, and the mean peak responses and the delays are shown in Fig. 4 and Table 2, respectively.

