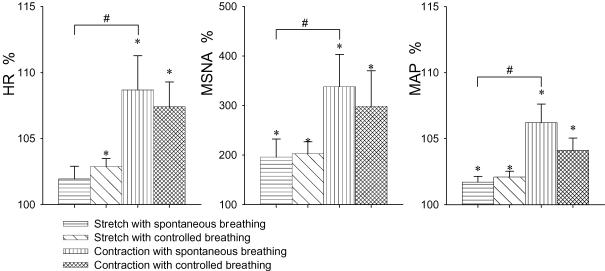
Figure 4. Peak responses of heart rate (HR), MSNA and mean blood pressure (MAP) to passive stretch and active contraction.
The responses were expressed as a percentage of the mean values of 10-beats data prior to the stretch or contraction (100%). Subject numbers for the respective condition are shown in Table 1. There was no significant difference in the peak responses between the spontaneous and controlled breathing conditions. *Significantly different from the prior stretch/contraction baseline (P < 0.05). #Significantly different from the stretch with the same breathing condition (P < 0.05).

