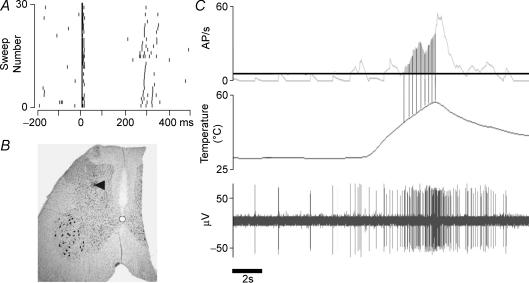
Figure 1. Data from an individual Class 2 dorsal horn neurone.
A, raster plot to illustrate the response of the neurone to supramaximal electrical stimulation in its cutaneous receptive field at time zero. B, photomicrograph to illustrate the recording site (pontamine sky blue (PSB) deposit) in the dorsal horn. C, response to a fast heating trial. Top trace, average discharge frequency per second. Middle trace, skin temperature. Lower trace, extracellular unit recording. Vertical lines, 1°C bins. Continuous horizontal line, background level of firing which is subtracted from the firing rate to calculate the magnitude of the response (shaded area).

