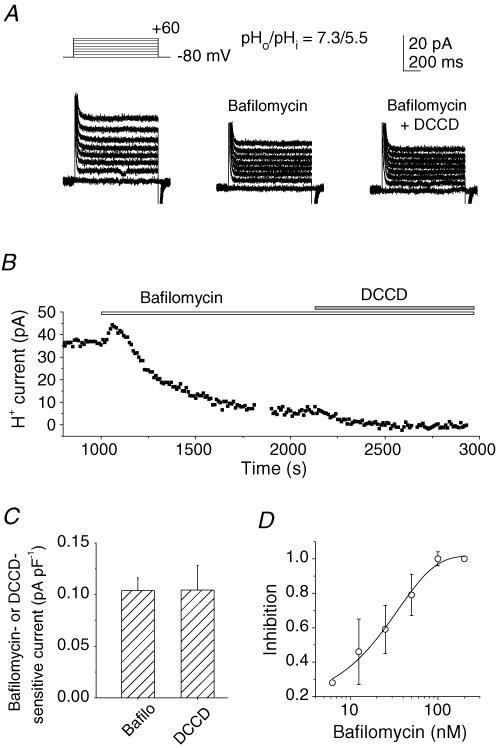
Figure 2. V-ATPase currents in osteoclast-like cells.
A, whole-cell currents in a cell before (left panel) and 10 min after application of 200 nm bafilomycin A1 (middle panel) and with addition of DCCD (100 μm; right panel). Leak currents were not subtracted. Capacitive currents at the onset and the end of the depolarization pulses are truncated. B, a representative time course for changes in the H+ currents at 0 mV during subsequent application of bafilomycin A1 (200 nm) and DCCD (100 μm). The abscissa represents the time after rupture of the patch membrane. Bafilomycin A1 was added after the currents reached a steady state. A and B were obtained from different cells. C, bafilomycin A1 (200 nm, n = 25) and DCCD (100 μm, n = 11)-sensitive currents. The data are the current densities at 0 mV obtained from different cells: 0.104 ± 0.012 (n = 25) and 0.104 ± 0.024 pA pF−1 (n = 11), respectively. D, dose–response relationship of inhibition of V-ATPase currents by bafilomycin A1 (6.25–200 nm). The inhibition at different concentrations was normalized to the value at 200 nm in each cell and averaged (n = 2–5). In A–D, the pipette contained 5 mm ATP; pHo/pHi was 7.3/5.5. Data in C and D are means ± s.e.m.

