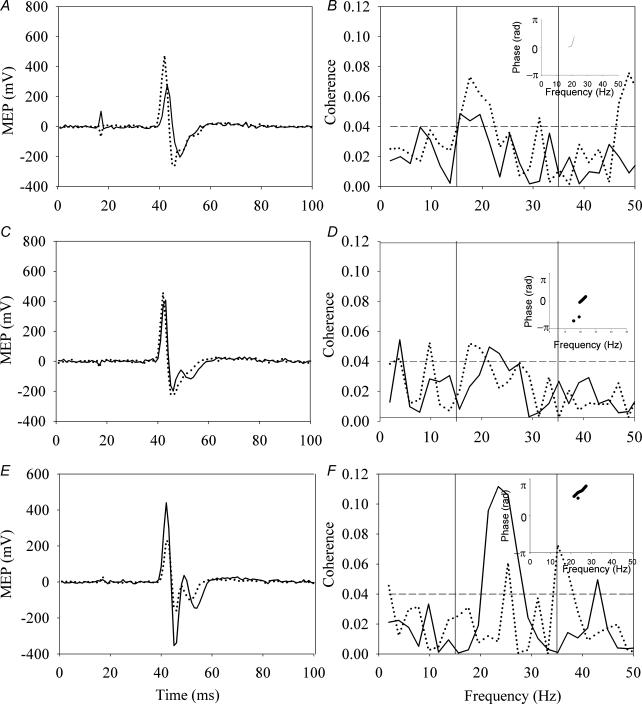
Figure 1. Typical results in each of the three stimulation conditions.
The left panel illustrates the motor evoked potential (MEP) response in the first dorsal interosseous (FDI) muscle, while the middle panel illustrates the MEP response in the extensor digitorum communis (EDC) muscle before (continuous line) and immediately after (dashed line) 10 min of transcranial direct current stimulation (tDCS), average of 15 responses. The right panel illustrates the area of coherence between the FDI and EDC during a sustained contraction before and after tDCS. The top row illustrates the results obtained with anodal stimulation (A, B and C), the middle with sham stimulation (D, E and F), and the bottom with cathodal stimulation (G, H and I). The phase plots (insets in C, F and I) show that there is a consistent phase relationship between the two muscles in the frequency range in which the coherence is found, indicating that the coherence assessment is valid.

