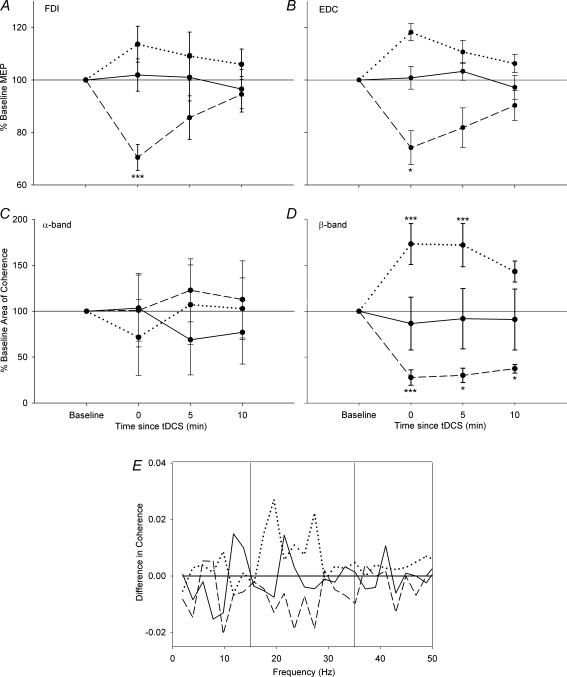
Figure 2. Group results illustrating changes in MEP and coherence.
Changes in MEP peak-to-peak amplitude for the FDI (A) and EDC (B) muscles are represented in the top row, while changes in the area of coherence for the α- (C) and β-band (D) are in the middle row. The bottom row displays the significant subtracted coherence (E) (Riddle & Baker, 2005) for each of the three stimulation conditions. The group results show the same trend as the typical results in Fig. 1. The continuous line shows the effect of sham stimulation, the dotted line shows the effect of anodal stimulation, and the dashed line shows the effect of cathodal tDCS. The MEP amplitude increased significantly, as did the area of β-band coherence, after anodal tDCS, and it decreased with cathodal tDCS, whilst no change was observed with sham stimulation. No significant change was observed in the α-band. E, change in coherence across all subjects and stimulation conditions. Anodal stimulation gave rise to a broad increase in coherence in the β-band, cathodal stimulation led to a broad decrease in coherence in the β-band, and sham stimulation did not produce any trend in the results. Error bars represent the variation between subjects. *P < 0.05, **P < 0.01, ***P < 0.005.

