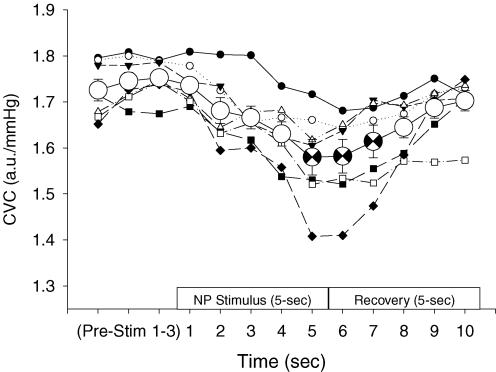
Figure 3. Representative data from one subject during whole-body heating in response to neck pressure (NP).
Cutaneous vascular conductance (CVC) responses to individual trials of NP are represented by the multiple data indicated with smaller symbols. Peak changes from these data were used for the traditional analysis. The averaged CVC response for these individual trials is indicated by the larger, open circle symbols (±s.e.m.). The averaged peak data are indicated by the partially filled, larger circles (occurring at seconds 5, 6 and 7); these are the data used for the conservative analysis. The x-axis indicates the 3 s during prestimulus (Pre-Stim 1–3), followed by the 5 s of the neck chamber stimulus and the 5 s of recovery.

