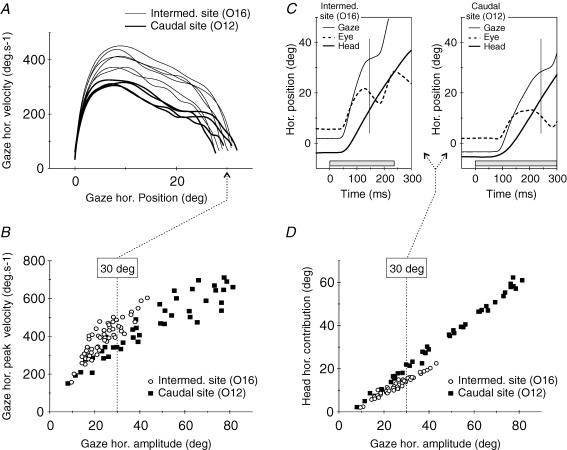
Figure 2. Comparison of the kinematics and eye–head coordination pattern of gaze shifts evoked by the stimulation of two different collicular sites in cat O.
Mean gaze radial amplitudes at 2 ×T were 31.1 deg and 72.7 deg for sites O16 and O12, respectively. A, velocity versus position phase plane plots of the horizontal component of individuals' gaze shifts. Although their horizontal amplitude was similar (around 30 deg), gaze shifts evoked from sites O16 and O12 using different current intensities differed in their kinematics. B, horizontal main sequence relationship for all gaze shifts evoked from these two collicular sites (all current intensities pooled together: from 1 ×T to 3 ×T and from 1 ×T to 2 ×T for O16 and O12, respectively). Note that, for a similar horizontal amplitude, the horizontal peak velocity was systematically lower for O12 than for O16. C, difference in the eye-head coordination pattern of two individual 30 deg gaze shifts evoked from sites O16 and O12 using different current intensities. Grey boxes show stimulation duration and vertical lines indicate the end of the saccadic gaze shifts. D, relationship between head horizontal contribution (concurrent head displacement) and gaze horizontal amplitude for all gaze shifts evoked from the two collicular sites, indicating a systematically higher head contribution for site O12.

