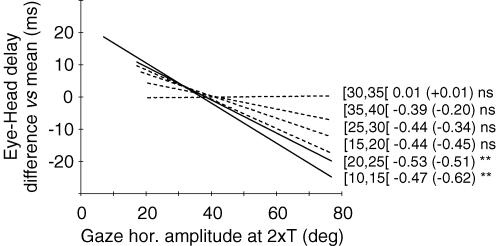
Figure 5. Summary of the effect of SC site position on eye–head delay for similar-amplitude gaze shifts.
The difference in eye–head delay with respect to the grand mean is plotted as a function of the site position for 5 deg intervals of gaze shift amplitude. Linear regression functions obtained for all six amplitude intervals are superimposed. Same format as in Fig. 3C. Continuous and dashed lines correspond to statistically significant and non-significant relationships, respectively. Statistical significance of analyses is indicated: **P < 0.01; ns =P > 0.05 (see also Table 2).

