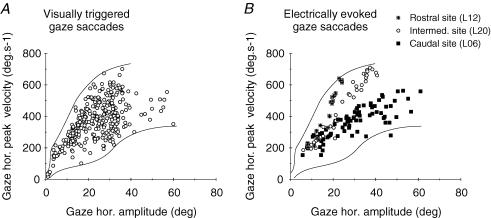
Figure 6. Kinematics of natural gaze shifts triggered by visual stimulation and of gaze shifts evoked by electrical stimulation of the SC.
A, horizontal main sequence relationship for visually triggered gaze shifts in cat L. Outlines of the scatter plot have been made by hand. B, horizontal main sequence relationship for gaze shifts evoked by the electrical stimulation of a rostral ( ), an intermediate (○) and a caudal (▪) collicular site (all current intensities pooled together). Outlines of the relationship shown in A have been superimposed. Note the differences in gaze horizontal peak velocity between the three different SC sites and the overlap between the two data sets formed by the electrically evoked and visually triggered gaze shifts. See text for further details.

