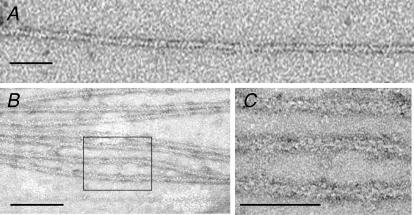
Figure 3. Transmission electron micrographs of negatively stained F-actin–rhcTm–EGTA (A) and F-actin–rhcTm–rhcTn–EGTA complexes on positively charged lipid monolayers (B and C).
C is the rectangular area in B, magnified. The scale bars represent 50 nm in A, 100 nm in B and 50 nm in C. Areas of additional density on the regulated thin filaments in B and C indicate physiological binding of the rhcTn complex to actin–rhcTm.

