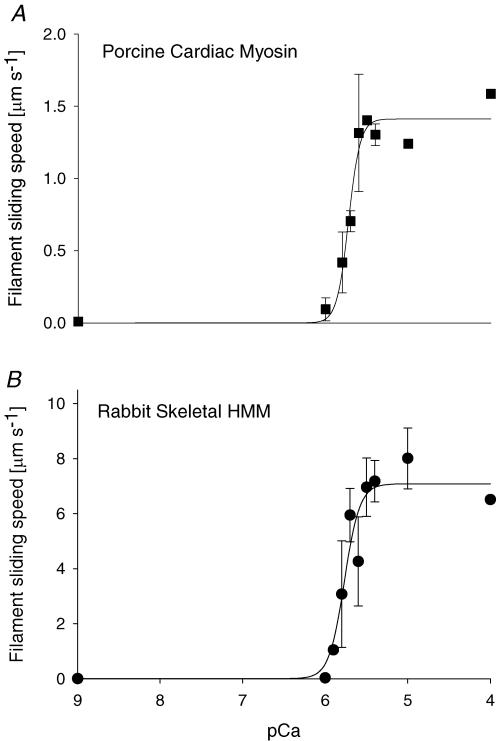
Figure 5. Ca2+ sensitivity of sliding speed for regulated thin filaments propelled by pcMyosin (β-MHC, A) or rsHMM (B).
Thin filaments were reconstituted with 15 nm rhcTn and 15 nm rhcTm. Each point represents the average thin filament sliding speed (n = ∼90 filaments for 2 flow cells) at the given pCa. Error bars represent standard deviation. The curves represent non-linear least squares regression fits to the Hill Equation (eqn (1)). There was no significant difference in the regression parameter estimates of pCa50 or nH (eqn (1)) between pcMyosin and rsHMM (see Results).

