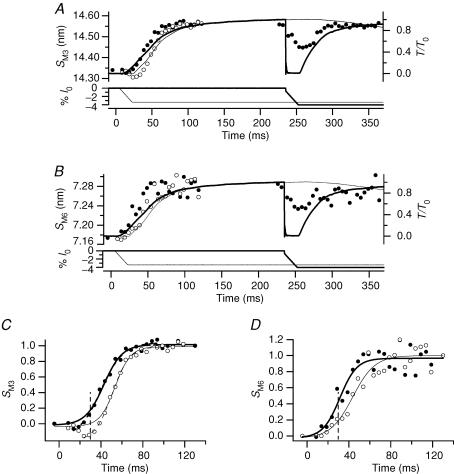
Figure 3. Spacing changes during the tetanus rise and during unloaded shortening.
Same experiments as Fig. 2. A and B, spacings of M3 and M6 reflections, SM3 and SM6, respectively. Thick and thin lines, and filled and open circles according to the description in Fig. 2A. C. fractional change in SM3 between rest and tetanus plateau. Continuous lines, sigmoid fits to data lying above 0; dashed lines, sigmoid fit to data starting from the lowest value. In the isometric tetanus (thick lines), the half-time for SM3 is 31.3 ± 1.6 ms for the continuous line and 30.9 ± 1.4 ms for the dashed line. In the tetanus with initial shortening (thin lines), the half-time for SM3 is 42.2 ± 1.4 ms for the continuous line and 42.2 ± 1.3 ms for the dashed line. The vertical dashed line marks the end of unloaded shortening. D, fractional change in SM6 between rest and tetanus plateau. Continuous lines, sigmoid fit to data. Vertical dashed line, end of unloaded shortening.

