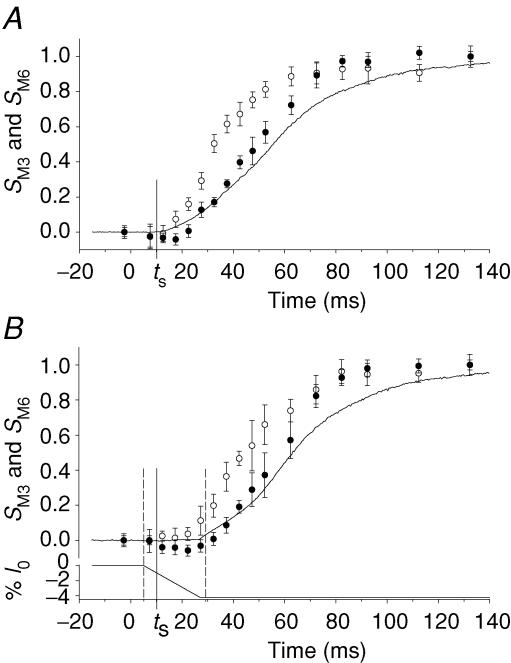
Figure 4. Effect of unloaded shortening on the time course of SM3 and SM6 changes during the tetanus rise.
X-ray patterns collected with FReLoN detector. Fractional spacing changes (mean ±s.d. from n = 3 fibres) between rest and tetanus plateau. In both A and B the continuous line is the force. Zero time is the start of stimulation. The vertical continuous lines indicate ts. A, SM3 (•) and SM6 (○) during the rise of the isometric tetanus. B, SM3 (•) and SM6 (○) in tetani with V0 shortening imposed 5 ms after the start of stimulation. Traces are force (upper) and imposed length change (lower). Vertical dashed lines mark the boundary of the average duration of unloaded shortening.

