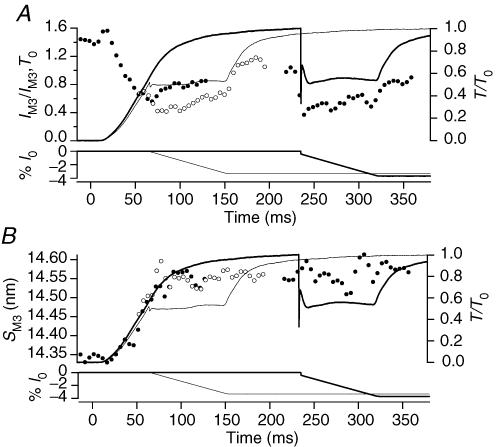
Figure 6. Effect of shortening at ¼V0 on IM3 (A) and SM3 (B).
Filled circles, X-ray data collected in tetani with ¼V0 shortening imposed at the isometric plateau (thick lines); open circles, X-ray data collected in tetani with ¼V0 shortening imposed 65 ms after the start of stimulation (thin lines). Data collected on the RAPID detector. In each panel lower traces are the imposed length changes (%l0) and upper traces the corresponding force responses (relative to T0).

