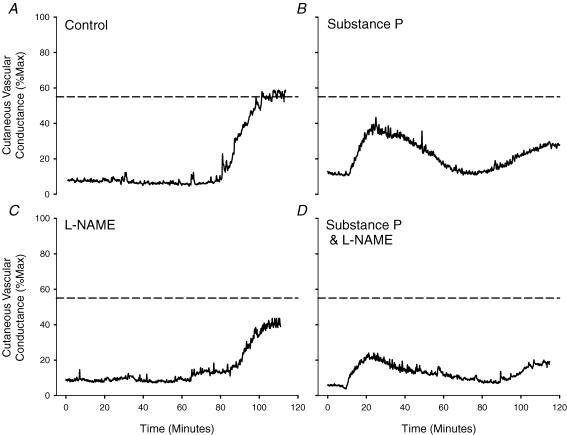
Figure 2. Representative tracing of the skin blood flow response to whole-body heat stress.
A, control sites; B, substance P-only sites; C, l NAME; D, substance P +l NAME sites. Dashed line indicates CVC response to whole-body heating in control sites. Note the nearly abolished CVC response to whole-body heating in sites pretreated with substance P plus l NAME (D).

