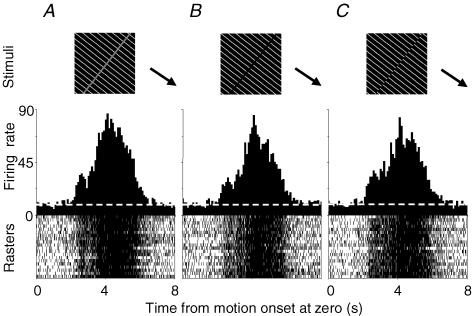
Figure 1. Histograms and rasters show visual responses of a pretectal neuron to real and illusory contours.
Grey bar (A) and grating gap (B) of 1.5 deg in width and 180 deg phase-shifted abutting gratings (C) were moved at the optimal speed (30 deg s−1) perpendicular to their orientations in the preferred temporonasal direction (arrows). The white stripe of gratings was 0.3 deg wide and spaced by 4.5 deg. Histograms were obtained by averaging 20 repeats and their rasters are shown below. Average firing rates in A, B and C were 45, 39 and 41 spikes s−1, respectively. Dashed lines represent the spontaneous level (9 spikes s−1). Time bin = 100 ms.

