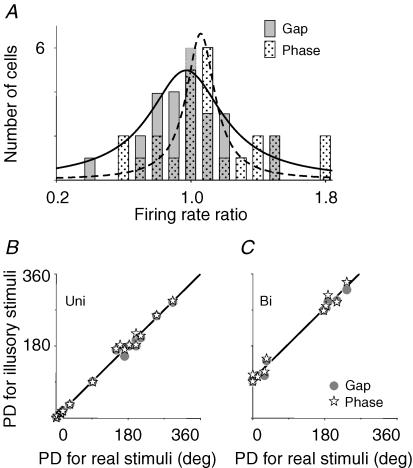
Figure 2. Correlation analysis of pretectal responses to real and illusory contours.
A, the distribution of 25 cells was plotted against their firing rate ratios (see Results). The continuous and dashed curves fitted with Lorentzian functions for grating gaps and phase-shifted gratings peaked at R = 0.97 and 1.1, respectively. The preferred directions (PD) of 20 unidirectionals for illusory contours are linearly related to those for real ones, with the intercept of 1.3 deg and slope of 1.0 (B). A similar graph was plotted for five bidirectionals (n = 2 × 5) showing that PD is changed by ∼90 deg (C).

