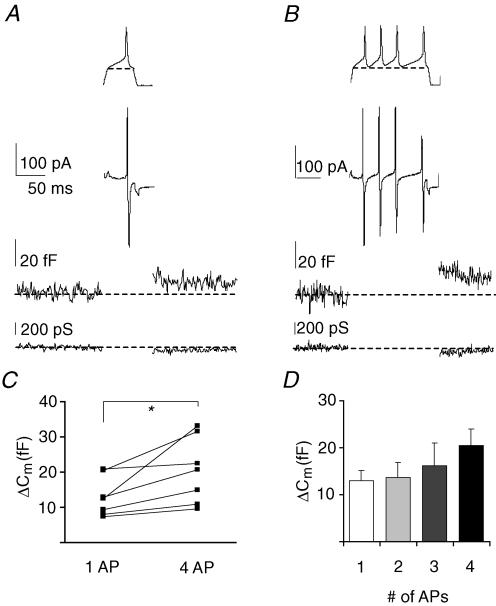
Figure 3. Somatic vesicle release evoked by a single action potential.
A, inward current, membrane capacitance and membrane conductance during a single action potential in nucleated patches (averaged trace, n = 7). The voltage template is shown above the current trace (bracket line: voltage protocol was adjusted to start and end at −70 mV to perform capacitance recordings). B, analogous responses during a train of action potentials in nucleated patches (averaged trace, n = 7). The voltage template is shown above the current trace. C, pair wise comparison of capacitance changes between single and train of action potentials (paired t test, P < 0.05, paired data from individual experiments). D, capacitance changes are dependent on number of action potentials.

