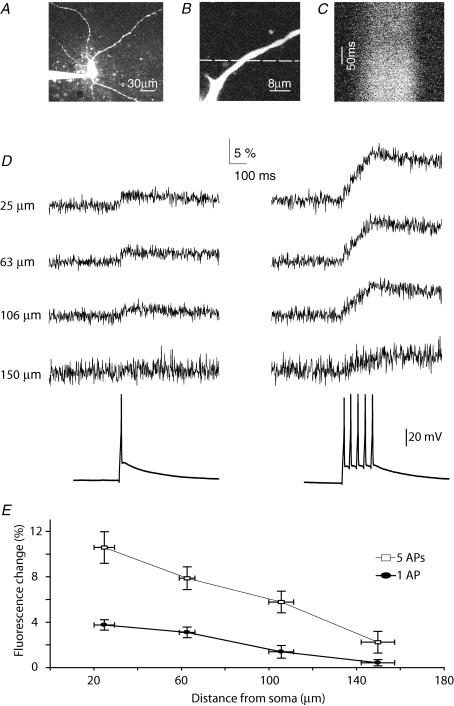
Figure 4. Dendritic calcium influx induced by single somatic action potentials is restricted to proximal regions.
A, overview of a 5-HT neurone. B, magnified image of a dendritic region used for line-scans. Dashed line indicates location where line-scan was taken. C, line-scan image following dendritic fluorescence of Fluo4 over time. D, green fluorescence transients (Δgreen/red ratio) in response to either single somatic action potentials (left) or trains of 5 action potentials (right) at different dendritic locations. E, summary data (n = 8), showing that AP-induced changes in ΔG/R ratio decrease with distance from the soma. Note that at 150 μm distance from the soma, a single action potential induces almost no fluorescence change.

