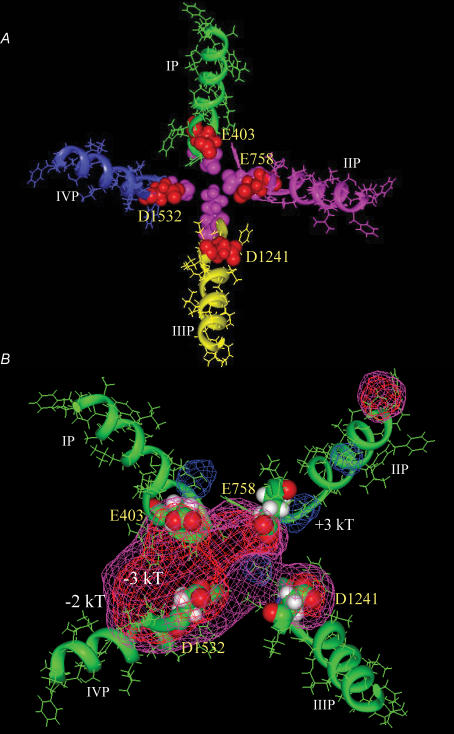
Figure 1. Molecular structural model of the Na+ channel (Top view).
A, the P-loops of domains I (green), II (pink), III (yellow) and IV (blue) are arranged in a clockwise manner with the outer charged ring (E403, E758, D1241 and D1532) shown in red space-filling format and the selectivity filter shown in pink space-filling format. B, the contours of the electrostatic isopotential surfaces at −2kT (purple), −3kT (red) and +3kT (blue) in the Na+ channel outer vestibule are shown. The S5 and S6 segments in domains I–IV were included in electrostatic potential calculations, but were omitted from the figure for clarity.

