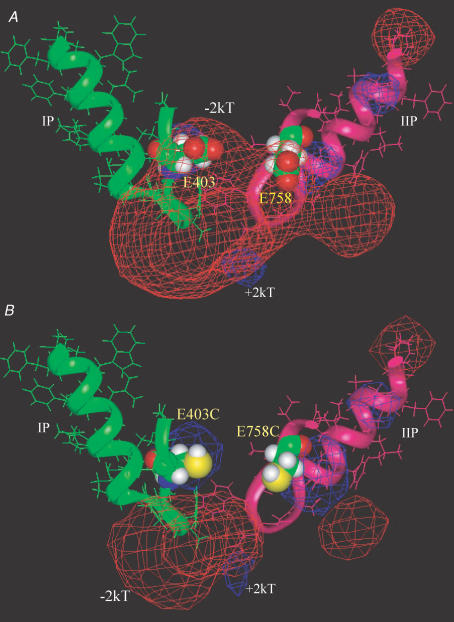
Figure 9. Significant electrostatic repulsion between E403 and E758.
A, the red mesh represents a −2kT isopotential electrostatic surface contour between E403 and E758 in close proximity in the wild-type channel. The P-segments in domains I (green) and II (pink) are shown in a ribbon and stick format. B, cysteine mutations at E403 and E758 positions (space-filling format) eliminates −2kT electrostatic potential contour between these two residues, but −2kT electrostatic isopotential surface could be seen around the inner ring of charge (DEKA). The P-segments of domains III–IV as well as S5 and S6 segments in domains I–IV were all included in electrostatic potential calculations with DelPhi, but omitted from this figure for clarity.

